Thresholding
Each pixel is set to 1 above a threshold and 0 below it. When processing an image, the foreground is usually set to 255 instead of 1, and the background to 0, so the pixels containing objects are white and the rest of the image is black. The result is a binary image that can be easily analysed. The threshold value is determined by the user, but there are algorithms to find it automatically (e.g. Otsu's method).
Adaptive Thresholding
If the intensity of the background is not uniform in the image, the adaptive (also called local) method may be more effective. Each pixel is given a unique threshold based on the weighted average of the intensities in its surroundings. This adaptive method is obviously much slower than the global method.
Area and center
When processing images, discrete operations are used instead of integration or derivation, since the function of an image is not continuous. In binary images, the area of the foreground is the number of white pixels, and the coordinates of its center are the average of the coordinates of white pixels on the two axes.
$ A = \displaystyle\sum_{y=1}^{H} \displaystyle\sum_{x=1}^{W} I(x,y) $
$ \bar{x} = \dfrac{1}{A} ⋅ \displaystyle\sum_{y=1}^{H} \displaystyle\sum_{x=1}^{W} x ⋅ I(x,y) $
$ \bar{y} = \dfrac{1}{A} ⋅ \displaystyle\sum_{y=1}^{H} \displaystyle\sum_{x=1}^{W} y ⋅ I(x,y) $
Orientation of an object: PCA
There are several methods to determine the orientation of an object in a binary image, one of which is the PCA algorithm (Principal Component Analysis). This is used to reduce the dimensions of multidimensional data in data science, but since the first principal component in a two-dimensional image is the orientation, it is also suitable for this simple task. Mathematically, the orientation angle is the angle of a line that passes through the center and the sum of the distances from the points of the object to the line is minimum.
Step 1: Offset points
The first step in PCA is to offset the points so that the origin of the new coordinate system is the center point, meaning that the coordinates of the center must be subtracted from the coordinates of each point.
$ (2,3) \boldsymbol{\rightarrow} (-2,-1.6) $
$ (3,3) \boldsymbol{\rightarrow} (-1,-1.6) $
$ (4,4) \boldsymbol{\rightarrow} (0,-0.6) $
$ (5,5) \boldsymbol{\rightarrow} (1,0.4) $
$ (6;8) \boldsymbol{\rightarrow} (2,3.4) $
Step 2: Covariance matrix
On the diagonal of the covariance matrix is the variance of each dimension, and the other elements are the covariances of each pair of dimensions. The covariance of two sets of data indicates the strength of their linear relationship. The matrix therefore simply tries to capture the correlation between the dimensions in a dataset, for images, the size is 2×2.
$ C = \begin{pmatrix} Var(x') & Cov(x',y') \\ Cov(x',y') & Var(y') \end{pmatrix} $
$ Var(x') = \dfrac{1}{n} ⋅ \displaystyle\sum_{i=1}^{n} (x_i')^2 $
$ Var(y') = \dfrac{1}{n} ⋅ \displaystyle\sum_{i=1}^{n} (y_i')^2 $
$ Cov(x',y') = \dfrac{1}{n} ⋅ \displaystyle\sum_{i=1}^{n} x_i' ⋅ y_i' $
$ C = \begin{pmatrix} 2 & 2.4 \\ 2.4 & 3.44 \end{pmatrix} $
Step 3: Eigenvalues
When a vector and a matrix are multiplied together, the result is a new vector that may have undergone two changes from the original: a change in length and a change in direction. Given a matrix, if we are looking for a vector that will not change direction as a result of the multiplication, we are looking for the eigenvector of the matrix. In return, the eigenvector is the vector whose length changes the most. The eigenvalue tells us how much this change in length is. First, the eigenvalues must be calculated.
$ det(C - \lambda ⋅ I) = 0 $
$ I = \begin{pmatrix} 1 & 0 \\ 0 & 1 \end{pmatrix} $
$ det \begin{pmatrix} 2 - \lambda & 2.4 \\ 2.4 & 3.44 - \lambda \end{pmatrix} = 0 $
The formulas above will result in a quadratic equation, and the orientation angle can be calculated from the eigenvalue of the more significant eigenvector, which is the larger number of the two solutions.
$ \lambda_1 = 5.226 $
$ \lambda_2 = 0.214 $
Step 4: Orientation
Now that the eigenvalue is known, the corresponding eigenvector must be calculated. After substitution, the formula gives the first principal component (PC.1), but it is important that the eigenvector cannot be a zero vector. The first principal component, which is the eigenvector associated with the largest eigenvalue in the binary image, is the orientation vector of the object, from which the angle can be easily calculated. Knowing the size, center and the angle, a camera-equipped robot, for example, can confidently pick up objects.
$ (C - \lambda ⋅ I) ⋅ \vec{v} = 0 $
$ \begin{pmatrix} 2 - \lambda & 2.4 \\ 2.4 & 3.44 - \lambda \end{pmatrix} ⋅ \begin{pmatrix} v_1 \\ v_2 \end{pmatrix} = \begin{pmatrix} 0 \\ 0 \end{pmatrix} $
$ \begin{pmatrix} -3.226 & 2.4 \\ 2.4 & -1.786 \end{pmatrix} ⋅ \begin{pmatrix} v_1 \\ v_2 \end{pmatrix} = \begin{pmatrix} 0 \\ 0 \end{pmatrix} $
$ PC. 1 = \begin{pmatrix} 1 \\ 1.344 \end{pmatrix} $
$ \varphi = atan2(1.344, 1) = 53.35° $
Help
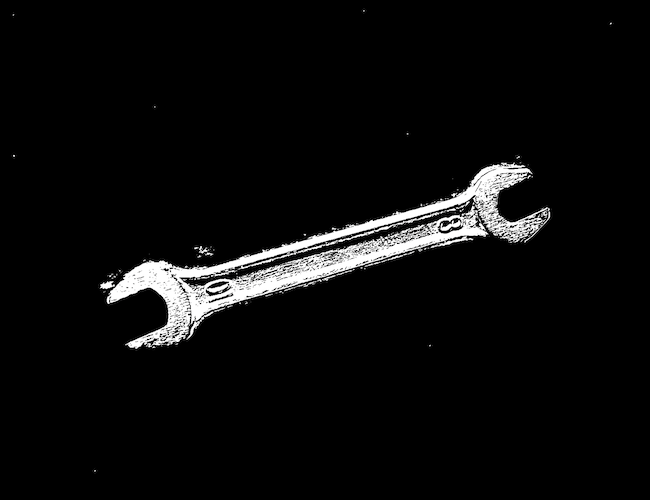
Wrench image: Download
Image sequence: Download
Source code: Center
from PIL import Image
import numpy as np
import matplotlib.pyplot as plt

# Open the image and convert to grayscale
image = Image.open("path-to-resources/wrench.png").convert("L")

# Convert image to a NumPy array
data = np.array(image, dtype=np.uint8)

# Apply thresholding
threshold = 135
data = np.where(data > threshold, 255, 0)

# Convert image from {0, 255} to {0, 1} (Normalize)
data = data / 255

# Helper arrays to calculate the center
x_range = np.arange(0, data.shape[1])
y_range = np.arange(0, data.shape[0])

# Calculate area and center
area = data.sum()
x_cntr = np.matmul(data, x_range).sum() / data.sum()
y_cntr = np.matmul(data.T, y_range).sum() / data.sum()

# Display the image
plt.imshow(data, cmap="gray")
plt.plot(x_cntr, y_cntr, "og", markersize=5)  # Mark center with green circle
plt.title("Center point")
plt.axis('off')  # Hide the axis
plt.show()
Source code: Orientation
from PIL import Image
import numpy as np
import matplotlib.pyplot as plt

# Open the image and convert to grayscale
image = Image.open("path-to-resources/wrench.png").convert("L")

# Convert image to a NumPy array
data = np.array(image, dtype=np.uint8)

# Apply thresholding
threshold = 135
data = np.where(data > threshold, 255, 0)

# Convert image from {0, 255} to {0, 1} (Normalize)
data = data / 255

# Helper arrays to calculate the center
x_range = np.arange(0, data.shape[1])
y_range = np.arange(0, data.shape[0])

# Calculate area and center
area = data.sum()
x_cntr = np.matmul(data, x_range).sum() / area
y_cntr = np.matmul(data.T, y_range).sum() / area

# --- PCA (Principal Component Analysis) ---
# Extract foreground pixel coordinates
y, x = np.nonzero(data)
coords = np.column_stack((x, y))
# Centered array
cntr_coords = coords - (x_cntr, y_cntr)
# Covariance matrix
cov_matrix = np.cov(cntr_coords, rowvar=False)
# Eigen value decomposition (EVD) to find the principal components
eig_vals, eig_vecs = np.linalg.eigh(cov_matrix)
# Eigenvector corresponding to the largest eigenvalue
pr_eig_vec = eig_vecs[:, np.argmax(eig_vals)]
# Orientation angle in radians
orientation = np.arctan2(pr_eig_vec[1], pr_eig_vec[0])

# Start and End point for the orientation line
half_len = 500
x_line = [x_cntr - half_len * np.cos(orientation), x_cntr + half_len * np.cos(orientation)]
y_line = [y_cntr - half_len * np.sin(orientation), y_cntr + half_len  * np.sin(orientation)]

# Display the image
plt.imshow(data, cmap="gray")
plt.plot(x_line, y_line, color="red", linewidth=3)  # Draw a red line on the image
plt.plot(x_cntr, y_cntr, "og", markersize=5)  # Mark center with green circle
plt.title("Center and orientation")
plt.axis('off')  # Hide the axis
plt.show()
Source code: Orientation (sequence)
        from PIL import Image
import numpy as np
import matplotlib.pyplot as plt
import os

# Folder containing the image sequence
folder_path = "path-to-resources/wrench-sequence"

# Set threshold value
threshold = 175

# Loop through each image in the folder
for filename in sorted(os.listdir(folder_path)):
    if filename.startswith("wrench00108"):
        # Open the image and convert to grayscale
        image_path = os.path.join(folder_path, filename)
        image = Image.open(image_path).convert("L")

        # Convert image to a NumPy array
        data = np.array(image, dtype=np.uint8)

        # Apply thresholding
        data = np.where(data > threshold, 255, 0)

        # Convert image from {0, 255} to {0, 1} for center calculation
        data = data / 255

        # Helper arrays to calculate the center
        x_range = np.arange(0, data.shape[1])
        y_range = np.arange(0, data.shape[0])

        # Calculate area and center
        area = data.sum()
        x_cntr = np.matmul(data, x_range).sum() / area
        y_cntr = np.matmul(data.T, y_range).sum() / area

        # --- PCA (Principal Component Analysis) ---
        # Extract foreground pixel coordinates
        y, x = np.nonzero(data)
        coords = np.column_stack((x, y))
        # Centered array
        cntr_coords = coords - (x_cntr, y_cntr)
        # Covariance matrix
        cov_matrix = np.cov(cntr_coords, rowvar=False)
        # Eigen value decomposition (EVD) to find the principal components
        eig_vals, eig_vecs = np.linalg.eigh(cov_matrix)
        # Eigenvector corresponding to the largest eigenvalue
        pr_eig_vec = eig_vecs[:, np.argmax(eig_vals)]
        # Orientation angle in radians
        orientation = np.arctan2(pr_eig_vec[1], pr_eig_vec[0])

        # Start and end point for the orientation line
        half_len = 300
        x_line = [x_cntr - half_len * np.cos(orientation), x_cntr + half_len * np.cos(orientation)]
        y_line = [y_cntr - half_len * np.sin(orientation), y_cntr + half_len  * np.sin(orientation)]

        # Display the image
        plt.figure(1); plt.clf() # This is needed to refresh the image
        plt.imshow(image, cmap="gray")
        plt.plot(x_line, y_line, color="red", linewidth=3)  # Draw a red line on the image
        plt.plot(x_cntr, y_cntr, "og", markersize=5)  # Mark center with green circle
        plt.title(f"Orientation of {filename}")
        plt.axis('off')  # Hide the axis
        plt.pause(.033)  # This is needed to refresh the image